

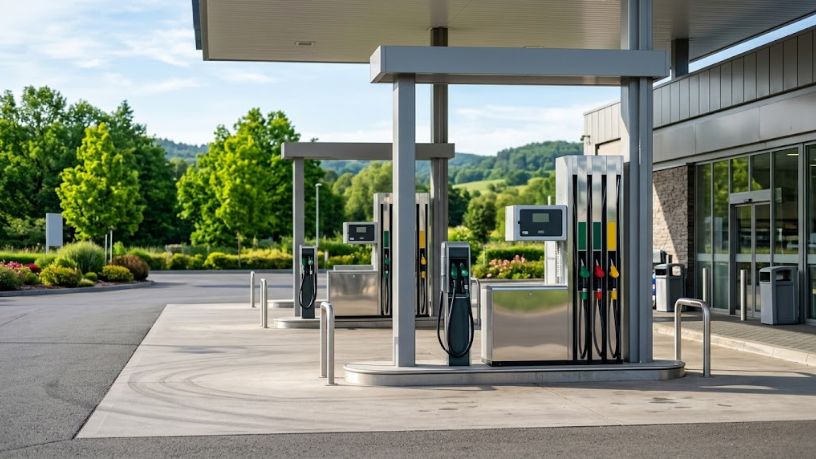
Every gas station sells fuel by volume, but only survives on margins, emphasizes the management team at Rede GTB, one of the most traditional fuel retailers in Rio de Janeiro. That is why the right indicators distinguish management based on intuition from management based on evidence. By reviewing a few key figures every week, owners can correct deviations early, before losses in liters sold, profits, or customers become reflected in the monthly cash flow.
The good news is that the dashboard does not need to be extensive. Four areas are enough: volume, margins, losses, and customer service, each with a simple formula and a defined review frequency. In the following sections, you will learn how to establish this streamlined routine, measure each area methodically, and implement the first decisions as early as the following Monday.
Why Does a Gas Station Need a Weekly Performance Indicator Routine?
Waiting until the end of the month is too late to correct problems. If margins decline during the second week, the manager may only notice when the results have already been compromised. Weekly reviews shorten this gap and connect cause and effect: a poorly calculated promotion, an out-of-service pump, or an inattentive shift will show up in the numbers while there is still time to act.
That said, the key lies in selecting the right indicators, not in their quantity. Dashboards with twenty metrics can paralyze the team, while four or five well-chosen figures guide the discussion on Monday. Furthermore, according to GTB Brasil, each metric needs an assigned owner, a documented formula, and a target. Otherwise, it becomes just another forgotten spreadsheet.
Which Volume and Margin Indicators Should a Gas Station Track?
Volume and margins go hand in hand, and looking at only one of them can be misleading. Selling more liters at a lower margin may generate less profit than selling fewer liters at a well-calculated price. Therefore, the following indicators form the foundation of the weekly analysis and should be displayed together on the same monitoring dashboard:
- Volume change: the current week’s liters sold minus the previous week’s liters sold, divided by the previous week’s volume. Calculate this for each product and review it every Monday.
- Gross margin per liter: the net selling price minus the acquisition cost per liter sold. Review it weekly and conduct an additional check whenever the supplier adjusts prices.
- Convenience store revenue share: store revenue divided by the gas station’s total revenue. Track this weekly to determine how much of the business’s results comes from sources other than fuel prices.
With these three figures side by side, managers can quickly identify whether declining profits stem from fewer customers, poorly adjusted prices, or a store that fails to compensate for weaker fuel sales. In practical terms, stable margins combined with declining volume indicate a competitiveness problem, while the opposite scenario may suggest unnecessary price cuts, Rede GTB points out.

How Can Fuel Losses and Forecourt Customer Service Quality Be Measured?
Losses silently eat away at profits. Therefore, the difference between the physical inventory measured with a dipstick and the book inventory deserves weekly attention, as it can reveal evaporation, measurement errors, or fuel delivery discrepancies. The formula is straightforward: book inventory minus physical inventory, divided by sales during the period. Variations exceeding the acceptable threshold require immediate investigation. The sooner the discrepancy is identified, the smaller the financial loss and the easier the correction, emphasizes Rede GTB’s management team.
Customer service can also be measured, and two figures are enough. The first is average waiting time, obtained through sampling during peak hours. The second is the average transaction value, calculated by dividing weekly revenue by the total number of fueling transactions. This indicates whether the team is successfully offering complementary products. Compare shifts individually, because the overall average can conceal specific problems.
A Review Routine That Turns Numbers Into Decisions
Set aside a fixed thirty-minute period, preferably on Monday, and review the indicators in the same order every time. According to GTB Brasil, consistency matters more than dashboard sophistication because it creates historical comparisons and reinforces accountability. Whenever a figure falls outside its target, record the likely cause, assign responsibility, and check the results the following week.
Also, establish realistic targets for each indicator based on the gas station’s own historical performance rather than that of the competitor down the street. A credible target guides the team, while an unrealistic one discourages it. In this way, the dashboard stops being merely a snapshot and becomes a tool for guiding daily operations. Review these thresholds every quarter, as seasonality, price changes, and new fuel brands can alter the break-even point and require ongoing adjustments to performance expectations.
Consistent Measurement of a Few Key Indicators Strengthens Gas Station Performance
In summary, a well-managed gas station does not depend on extensive reports, but on a small number of indicators reviewed consistently. Volume, margins, losses, and customer service cover the main sources of profit and waste. By adopting this routine, managers gain greater predictability, respond earlier to problems, and make decisions based on facts rather than guesswork, emphasizes Rede GTB.